How to Enable Debugging Keyboard Shortcuts
Learn how to enable debugging keyboard shortcuts across popular platforms with practical, step-by-step guidance from Shortcuts Lib. Improve efficiency safely.

You will learn how to enable debugging keyboard shortcuts across editors, browsers, and OS settings. This guide covers per-application bindings first, then OS-level tweaks, with practical examples and safety tips. By the end, you’ll have a customized, testable set of keystrokes that speed up your debugging workflow.
What debugging keyboard shortcuts are and why you might want to enable them
Debugging keyboard shortcuts are customized keystrokes that trigger debugging actions across tools, editors, and browsers. They help you start a debug session, step through code, inspect variables, and pause execution without breaking your workflow. The goal is to reduce context switching and accelerate iteration when working with complex projects. According to Shortcuts Lib, a well-configured set of shortcuts can improve efficiency and lower cognitive load during debugging. This section clarifies what counts as a debugging shortcut, why enabling them matters, and how to approach safe customization. You’ll learn the difference between per-application bindings and OS-level overrides, plus a practical framework to start from today.
Prerequisites and safety considerations
Before you begin, back up your current configurations and ensure you have a recoverable baseline. Export existing keyboard mappings if your editor or IDE supports it. Per-app bindings usually don’t require administrator rights, but system-wide changes might. Check your organization’s policies on accessibility and keyboard usage to avoid conflicts that hinder daily work. Start with a small, core set of bindings to test the workflow without overwhelming the setup.
Platform-wide overview: OS-level vs app-level shortcuts
Shortcuts exist at two levels: OS-wide bindings and per-application bindings. OS-level shortcuts affect all programs, so changing them can disrupt common tasks and accessibility features. Per-application shortcuts stay local to a single tool, reducing cross-application conflicts and making it easier to refine a debugging workflow. Shortcuts Lib analysis suggests developers tend to begin with app-level bindings to tailor actions to their typical tasks, then consider OS-level changes only when a broader automation is required. This approach minimizes surprises and keeps debugging predictable.
Enabling debugging shortcuts in a popular editor: a case study with VS Code
VS Code provides a flexible keybindings system that lets you map commands to most keystrokes. To enable a debugging shortcut, open the command palette (Ctrl/Cmd+Shift+P), choose Preferences: Open Keyboard Shortcuts, and search for the desired debug command (for example, Start Debugging or Step Over). Click the pencil icon to bind a new key, then press your chosen combination. Save the change and test by starting a debug session from a minimal script. Keeping bindings consistent across projects reduces confusion and speeds up repeated tasks, a recommendation echoed by the Shortcuts Lib team.
Enabling in browser DevTools for debugging JavaScript
Modern browsers expose debugging commands in their DevTools panels. Open DevTools (F12 or right-click → Inspect), go to Settings or Shortcuts, and adjust commands such as Pause, Step Over, and Resume. If a conflict arises with an extension or site-specific shortcuts, rebind the DevTools command to a less-used key or create a separate DevTools profile. Test with a simple page to confirm the new bindings are functioning as intended. This ensures quick iterations during front-end debugging without leaving the browser.
Conflicts, testing, and refinement of your shortcuts
Conflicts are the most common reason a shortcut fails. Use built-in conflict detectors in editors or the OS to identify overlapping bindings, then resolve by renaming, reordering, or removing the least-used command. Test in a controlled workflow: run a small debugging session, perform typical steps, and note any missed keystrokes. Refine bindings to favor frequently used commands and avoid keys already assigned to critical actions. Keep documentation handy to maintain consistency across devices and teams.
Best practices and next steps for reliable debugging shortcuts
Start with a compact, well-documented core set of bindings, then expand as needed. Create a per-project profile plus a global profile to switch contexts quickly. Regularly back up configurations and store them in a versioned file. Finally, consider accessibility: avoid overly complex keystrokes that hinder users relying on assistive technologies. The most reliable path is to begin with editor-specific bindings before moving to OS-wide overrides, minimizing risk and preserving system stability.
Tools & Materials
- Computer with internet access(Ensure admin rights if modifying system-wide shortcuts)
- Editor/IDE with customizable shortcuts(Examples: VS Code, JetBrains IDEs, Sublime Text)
- Operating system keyboard settings access(Admin access not strictly required for per-app bindings)
- Shortcut configuration reference sheet(Print or save for quick reference)
Steps
Estimated time: 20-40 minutes
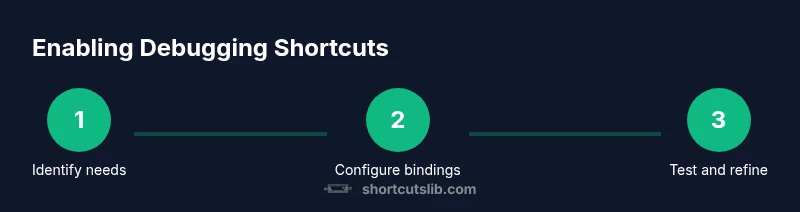
- 1
Identify debugging scenarios
List the debugging commands you want to streamline and the typical workflow where they occur. This creates a focused scope that prevents binding fatigue and ensures you gain tangible speed gains.
Tip: Keep a short list of the top 3 commands you use most during debugging. - 2
Open your editor's keyboard shortcuts settings
Navigate to the keyboard shortcuts area in your editor or IDE. Review existing bindings to avoid overwriting essential commands and identify the best spots for new debug actions.
Tip: Use the search function to locate the exact debug commands quickly. - 3
Create a new binding for a debug command
Bind a recognized debug action (like Start Debugging) to an unused keystroke. Keep modifiers (Ctrl/Alt/Cmd) for reliability and to reduce accidental triggers.
Tip: Prefer combinations that are mnemonic to the action (e.g., Ctrl+Shift+D for Debug). - 4
Check for conflicts and adjust
If your chosen key is already in use, remap or disable the existing binding and re-test the new one. Resolve any issues before moving on.
Tip: Document changes to avoid drift across projects. - 5
Test the new shortcut in a minimal project
Run a small debugging session to verify the binding triggers the intended action. If it doesn’t, inspect the binding configuration and console logs for errors.
Tip: Use a test script with a simple breakpoint to validate quickly. - 6
Export and back up your configuration
Save the binding file to a secure location and note which project profiles it belongs to. Create a changelog for future references.
Tip: Store a versioned copy in your project repo for portability.
Questions & Answers
Do I need to enable debugging shortcuts for each tool separately?
Yes. To ensure reliable operation, set bindings within each editor and in DevTools as needed. OS-level changes can interfere with these bindings, so manage them carefully.
Yes. Start with one tool and expand as you confirm the workflow works smoothly.
What should I do if a shortcut doesn't work?
Check for conflicts, reset to a known-good binding, and re-test with a simple action. If issues persist, review the binding scope and environment.
Check conflicts and try a standard binding first.
Can I share and import my shortcut configurations across machines?
Many editors support export/import of keybindings. Keep a versioned file in your repo and re-import on other machines.
Yes, export and reuse across devices.
Are there accessibility concerns when creating shortcuts?
Avoid overly complex keystrokes that may hinder users relying on assistive tech. Prefer moderate, mnemonic combos and provide fallback methods.
Be mindful of accessibility and use reasonable bindings.
Is this approach safe for production environments?
Yes if you separate development shortcuts from production tooling and avoid overwriting core OS shortcuts. Keep a clear boundary between debugging and daily use.
Yes, keep development bindings in the developer workspace.
Watch Video
Main Points
- Define a focused core binding set
- Test for conflicts before saving
- Document and back up configurations
- Prefer per-app bindings before OS-wide changes